In this first of a two part blog post I will introduce you to deeper analysis of your website statistics and provide a basic understanding on how visitors arrive at your site. In my second post I’ll share some ideas to help regain your digital audience after recent major changes.
Check your website stats for your Source/Medium traffic
If your objective is to drive traffic to your institutional or project websites or blogs then checking how visitors arrived there will reveal any potential trends. For the majority of website managers, we can use Google Analytics and split this web traffic (Acquisition > All Traffic > Channels) into the following categories:
Organic: visitors using search engines to discover website content (Google usually dominating the share high and, for IDS represents, 95% of Organic). You may find that the keywords used mean that a fair share of the audience are already aware of your key products or specific content.
Direct: visitors who know the website address are either entering it manually or using saved bookmarks
Referral: This traffic is generated by other websites linking to your site. We love these!
Social: you may be surprised (well I was) that Google expands their definition of Social to include blog platforms (Blogger and WordPress), multimedia (YouTube, Soundcloud, Flickr etc.) by default as well as the well-known social media sites such as Facebook, Twitter etc. You may find that some WordPress-based websites (without any blog function) are being treated as Social traffic where they should be Referral.
Email: any traffic generated from email newsletters either from your own lists or others.
If your website or blog has been online for more than a year you’ll be able to compare time periods and discover trends i.e. which of the above channels are expanding or declining.
How do visitors arrive at the IDS website?
For IDS, the majority of traffic comes from Organic search (around 60%). Direct and Referral traffic has seen a small decline with Social muscling in to grow from 5% to around 12% over the past 3 years. Finally, Email provides the smallest share.
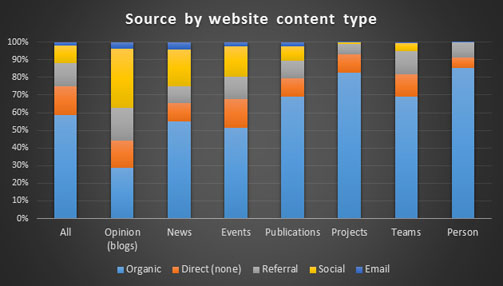
Deeper analysis shows that visitors enter the website differently to the overall channel breakdown therefore varying the channel ratio too. The IDS website hosts a number of web pages with specific types of content including blog posts, news articles, publications, events, and people profiles. It’s no great surprise then to see that Blog posts and News articles receive more than a third of its traffic from social media (as shown below). Compare this to less topical content like staff profiles and research projects as they are visited via search engines using keywords and phrases.
Device check: how visitors differ when using mobile
As well as the Source channels to consider, statistics can also reveal what Devices are being used to consume our web content. Mobilephones have seen a huge growth in popularity and usage. IDS has an international audience and this increase is especially evident in developing countries where 3G networks and lower phone costs allow faster uptake.
By segmenting the web traffic numbers in the different device i.e. Desktop, Tablet and Mobile you can analyse for the following:
Bounce Rate: the visit consists of just one web page then bounces away. High percentages will confirm this issue
Average Session Duration: find out how much time a web page is being viewed on average. For blog posts, you want this in minutes not seconds
Pages per Session by Device: provides the number of web pages each visit consists of.
Analysing the IDS website over the past three years and we see a declining trend of the number of pages per session. This suggests that our visitors have less time to read our content or have shorter attention spans.
A final suggestion for segmenting your website statistics is to combine Visits by Device with their most popular Source channel. This should reveal trends on how your visitors prefer to visit. For instance, the share of IDS website ‘Direct’ visitors using their mobile device has more than doubled in the last three years. And there’s a similar story with visitors using Twitter with their mobiles. All this shouldn’t come as a surprise if comparing your own online habits but it’s good to see the evidence in graph form.
All the above will provide you with a better website dashboard for monitoring and evaluation. If you have experienced any surprising trends in your traffic channels then maybe the recent Google and Facebook algorithm changes will be the cause. Read my second part of blog for further details.