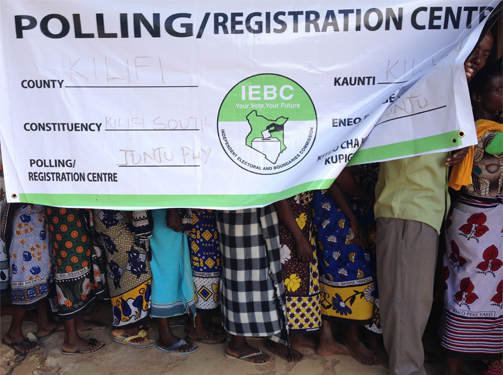
On the 8 August, Kenyans once again went to the polls. Amidst fears of election violence, and calls for peace and cohesion, voting took place in closely-run contests throughout the country.

As votes were tallied, Presidential candidate and opposition leader, Raila Odinga, alleged the Independent Electoral and Boundaries Commission (IEBC) system had been hacked, and the preliminary results fabricated in order to secure victory for the incumbent, Uhuru Kenyatta. The dispute plunged Kenya into a ‘dangerous limbo’: rioting broke out in a number of areas, and in the ensuing unrest, police clashed with demonstrators. In an atmosphere of uncertainty, there were allegations of the use of live bullets, covert paramilitary violence, and several deaths, many of which were disputed by security forces. Although insecurity was nowhere near the levels of widespread unrest that took place in 2007/2008, last week’s elections yet again witnessed sporadic outbursts of violence.
In the wake of these events, is there a role that social media and digital technology could play in monitoring insecurity? While digital platforms featured prominently in several aspects of the elections – from biometric voter registration, to the online publication of preliminary results, and the prevalence of fake news in Kenya’s ‘first social media election’ – a growing area in ICT4D, peacebuilding and violence research, is the use of these technologies to monitor, track and support response to insecurity. As part of an ESRC-funded project on New and Emerging Forms of Data for Crisis Response, IDS and Sussex researchers are seeking to understand the opportunities and limitations of social media for violence monitoring and crisis response.
Using Digital Technology to Monitor Violence
Among the measures put in place to monitor insecurity around the elections, were a number of early warning and crisis response systems. These include initiatives conducting media analysis on reports of violence; teams of social media monitors scanning platforms; and custom reporting systems for crowdsourcing reports on the elections, such as Uchaguzi.
Monitoring systems can play a vital role in preventing, reducing and responding to violence. Reports of tension or insecurity can be forwarded to first responders or peace-builders to try to de-escalate conflict or respond to needs on the ground. In the longer-term, policymakers and researchers can use data on violence to better understand and predict insecurity dynamics.
However, we still know very little about the kinds of reports different systems collect, how the incidents they capture differ from one another, and what the comparative advantages of discrete reporting systems are.
To address this gap, IDS and Sussex researchers have collected and analysed data using an automated search strategy developed at the University of Sussex, to analyse public posts on Twitter, filtering them for relevance to the Kenyan elections, insecurity, and peace. To date, reports have been monitored for five months, in the run-up to and immediately following the elections.
Timeliness of reporting
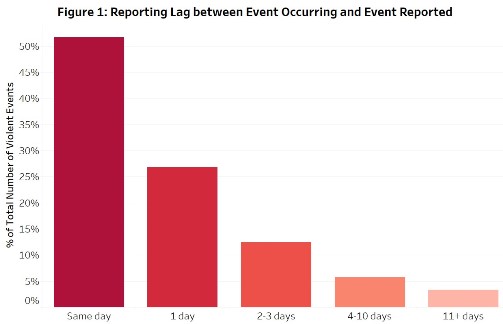
The timeliness of violence reporting is essential for first responders, practitioners and policymakers seeking to prevent, reduce or de-escalate violence. Preliminary analysis suggests that social media is a timely method for collecting reports: over 50 per cent of reports collected on Twitter referred to events that occurred on the same day; and a further 28 per cent referred to events in the past day. In other words, three out of four events were reported within a day of their occurrence.

When we compare this data with a sub-set of reports coded by the ACLED dataset from ‘traditional’ media sources (newspapers, newswires and published reports) in the run-up to the elections, we find that social media reports are considerably timelier. Although a comparable share of ‘traditional’ media reporting occurred on the same day (49 per cent), these had a longer average delay (3.5 days, compared to 1.4 days on Twitter) between an event occurring and it being reported.
Several factors, including the location of an incident, or limited availability of detailed information (pdf) in the immediate aftermath of violence, might account for these delays. In utilising these strategies, actors should consider how ‘real-time’ the reports they collect must be in order to support effective response.
The geography of violence risk
Accurately tracking the spatial patterns of violence can help ensure response is appropriate to needs across a country. However, different reporting systems can produce divergent pictures of where violence occurs. One of the risks of social media monitoring for crisis tracking is that it may inadvertently replicate social and economic inequalities, amplifying the voices of those with the greatest access to social media and digital infrastructure. Inequalities in digital access can reflect other social and economic inequalities, including poverty and marginalisation, meaning the most vulnerable voices may not be heard.
When we compare social media reports of violence with reports from ‘traditional’ media, we find significant differences in the locations of violence captured by both systems. First, social media reports are more heavily urban-focused: 63 per cent of reports on Twitter concern unrest in urban areas; compared to 53 per cent in more ‘traditional’ media reports. Our analysis suggests that Twitter is 9.7 per cent more likely to capture violence in urban areas than ‘traditional’ media sources.
Second, we see differences in the geography of violence in relation to economic development: the average GDP of the areas in which unrest was reported via Twitter is USD1279, compared to an average of USD1011 in the areas where ‘traditional’ media reported violence. Our preliminary findings indicate that Twitter is 13.2 per cent more likely to capture events in areas with relative higher GDP than traditional media sources.
Finally, this difference holds when we look at the nightlight index, a common proxy of infrastructural development, which has a higher average for Twitter reports than ‘traditional’ media, once more suggesting that social, economic and structural conditions matter.
These findings indicate that social media reporting is more effective at capturing violence in urban, and relatively economically developed, areas, than it is in rural areas. This suggests that violence that occurs in rural areas – where digital infrastructure and access to social media platforms may be more limited – may be unreported on Twitter; while it is being more comprehensively captured by ‘traditional’ media. These findings are consistent with our previous analysis comparing actively crowdsourced reports of violence with those captured by ‘traditional’ media, and suggest further avenues for future research.
Going forward
These preliminary findings suggest that social media and digital technology present opportunities and limitations for violence monitoring and crisis response. There are significant trade-offs which should be carefully weighed by practitioners, policymakers and researchers using similar strategies.
The data also suggests there are significant differences in the timing and geography of violence as captured by ‘new’ social media platforms, when compared to ‘old’ media monitoring systems.
One way to mitigate against these differences could be to triangulate and supplement monitoring systems using a wide variety of sources in order to reduce biases or gaps in any individual system. There is no doubt that there is clearly a need to continue in our efforts to understand and find ways to effectively and accurately monitor violence, but we have to ensure we do this in a way that produces robust, reliable and actionable data.
—
Nb. Figure is author’s own