Lebanon, crippled by the continuing financial crisis; soaring poverty; a refugee crisis; deteriorating public services; deep political instability; the Covid-19 pandemic; and the last straw a month ago, the devastating 4 August blast and the tumultuous string of events that followed, is a country where Security and Rule of Law (SRoL) is in a state of rapid and continuous change.
In this blog, through the case of Lebanon, we demonstrate the potential of near-real-time big data sources to inform policymakers in the field of SRoL, which could significantly help shape policy initiatives to tackle some of these urgent challenges.
GDELT data for monitoring SRoL events
The Global Database of Events, Language, and Tone (GDELT) project, ‘monitors the world’s broadcast, print, and web news from nearly every corner of every country’, and is the world’s largest and most up to date publicly available dataset for SRoL relevant media events.
However, accessing this database involves a steep learning curve. We address this problem in the recently launched GDELT dashboard for Lebanon. Our expectation is that it would help open the GDELT as a big data resource for practitioners and researchers interested in near-real-time monitoring of SRoL.
The GDELT Dashboard for Lebanon
Our purpose was to showcase GDELT as a new source of near-real-time big data learning in SRoL and its potential for impact in policymaking. Our dashboard does this by:
- Bringing various elements of a big data life cycle (that also applies to GDELT) under one platform.
- Consigning the complexity of big data processes related to data extraction, storage, analysis/filtering, visualisation, sharing, etc. to the backend, allowing the user to focus on the data (see Fig 1).
- Using open-source resources that are free for non-commercial use. The purpose was to make the dashboard accessible to those with limited financial resources.
- Sharing detailed operational instructions, so that anybody interested could create their own dashboard for any other country.

The team involved in the development of this tool is led by the Institute of Development Studies (IDS) and have a strong background knowledge about Lebanon through local partners and because of antecedent projects (PALM, WURSHIJL). The dashboard was funded by KPSRL’s Knowledge Management Fund (KMF).
Co-designing the dashboard
Our dashboard was co-designed with policy actors representing the Dutch Ministry of Foreign Affairs (BZ) and members of the KPSRL community. This helped to generate wider appeal for the dashboard and to improve its relevance. Co-design opportunities during the short project period were limited. Yet, it was clear that with each interaction the quality of the dashboard improved and resulted in being much better equipped to meet the needs of the end user.
Proof of concept
A key element of this proof of concept exercise is convincing potential users that GDELT data is reliable. We did this using a couple of examples on how the GDELT data can accurately identify known historical events:
- Resignation of Hariri – 4 November 2017 (see ‘Example-1’ in the dashboard)
- WhatsApp Tax Introduction and the October Revolution (see ‘Example-2’ in the dashboard)
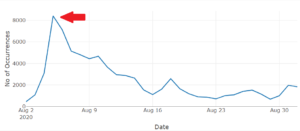
Importantly, the above examples instill confidence that GDELT data can be used to monitor SRoL events. For example, unusually high number of events are seen on the date of the blast (Fig 2). Similarly, pattern of geographic distribution (Fig 3) can reveal locally important SRoL events (Fig 3).

Going forward
As mentioned above, the dashboard can be further expanded to explore events in other countries. In fact, we have already built in routines within the current version of the dashboard so that an adapted focus of GDELT data on another country can be quickly made.
See for instance the dashboard for Syria, which was created using the free resources distributed with our dashboard (see the dashboard ‘How-To-Guide’ to adapt the tool to the country of choice).
An obvious next step is to develop the dashboard into a forecasting/prediction tool – a request made by policy actors during our discussions. This leads to a set of interesting questions around the adequacy of GDELT data for forecasting future SRoL conditions and whether new technologies such as artificial intelligence (AI) can play a role in developing such a tool. Though such technical questions are of interest, our experience from the current dashboard suggests that questions around setting up an honest co-design approach are perhaps more important going forward.